People & operations · Feature guide

CCTV queue management analytics

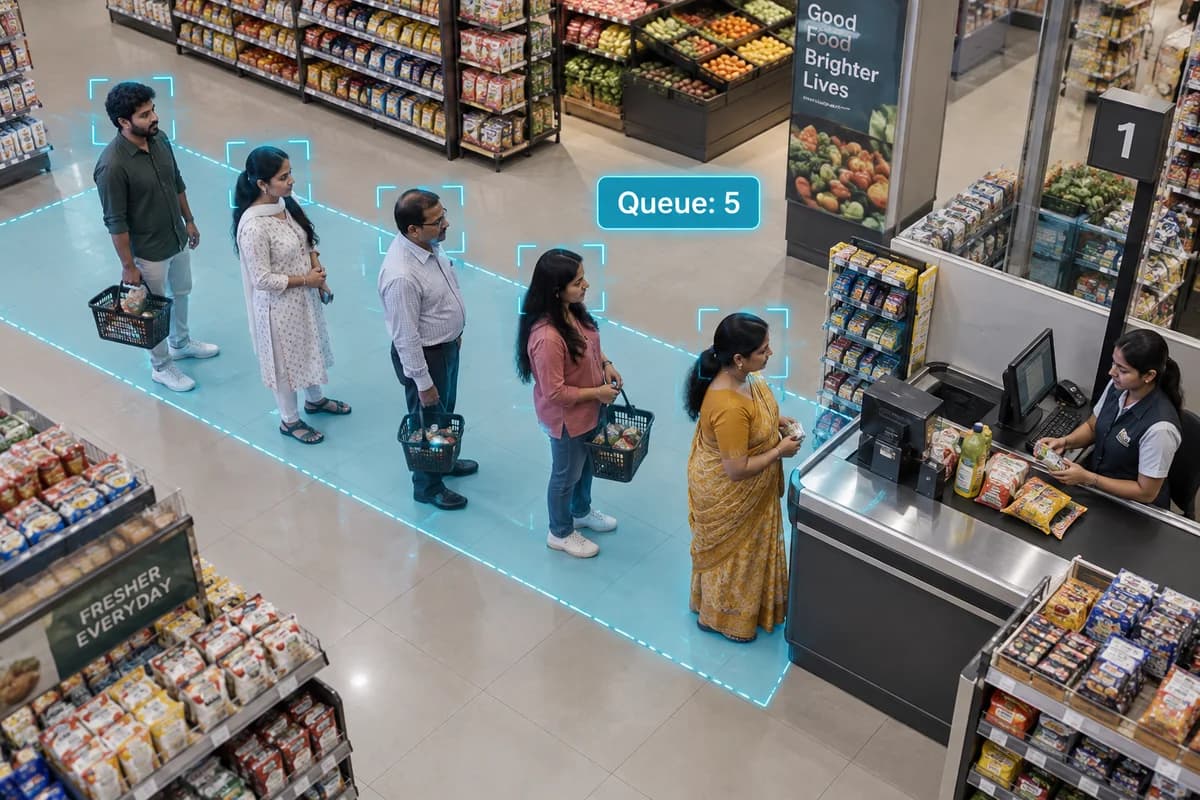
A queue can build before a supervisor notices it. CCTV queue analytics monitors a defined waiting area so a team can review congestion and decide when to open another counter or adjust staffing. The useful signal is the one that leads to a practical response.

Illustration of five shoppers in a monitored supermarket billing queue
AI-generated illustration of queue & crowd analytics. The scene and overlays explain the concept; they are not a PGAK screenshot or measured result.

How it works

Monitor congestion, dwell time and occupancy to help teams respond to busy areas.

Where it could help your business

Assess congestion at factory shift-change points.

Define where the queue begins and ends. Test groups standing beside the line and people who leave before reaching the counter. Review both the alert threshold and the time it takes staff to respond; a dashboard alone will not shorten a wait.

What your camera setup needs

Requires an appropriate view and configured thresholds. Crowds and occlusion affect accuracy.

Can one camera measure every queue in a shop?

Only if the views and supported analytics are suitable. Overlapping queues, obstructions and distant subjects may require separate camera coverage.

Check it on your own site

Bring a camera model list and explain the event you want to find or detect. We can use that to scope a compatibility assessment. Ask for a written proposal naming the supported functions, processing hardware, licences and pilot checks before agreeing to an installation.

Check my camera setup →

Calculator · C12

Queue analytics and heat maps: estimate it for your site

Use your own measurements. The result is a contribution-margin scenario, kept apart from cash, using the formula below. It runs in your browser and nothing is sent anywhere.

Fields start empty. A blank is “not entered”, not zero; type 0 where 0 is true.

Result

Enter your own figures, or load the worked example, to see the result.

How it is calculated

incremental contribution = visitors × (scenario − baseline conversion) × contribution per sale × attributable fraction

Worked example (illustrative inputs)

10,000 visitors; 20% baseline; 21% scenario; ₹150 contribution; half attributable.

contribution scenario: ₹7,500 a month.

Formula version 1.0.0. The full standalone tool: retail contribution.

What this does not tell you

  • This is a contribution-margin scenario, not a causal sales-uplift forecast. It is reported apart from cash and is not counted in net cash below.
  • Margin, not revenue: use what one more sale actually adds after its direct costs.

Evidence status: Supplier/integration or marketed capability; PGAK availability and site performance require verification.

Request a site-specific assessment with these assumptions

Your result stays on this page either way. If you want it checked against your cameras and quotation, leave a number; mention the figures on the call. Nothing you typed into the calculator is sent with this form.

Request a camera assessment. Timing and scope agreed on the call. By submitting, you ask PGAK to contact you about this enquiry. Privacy notice.